Do you have a website for your own or for your business?
Are you using Google Analytics for your site?
If the answer to this question is No, then as a website owner, you must have several unanswered questions in your mind.
Some of the most common questions that may come to your mind are:
- What number of people visit my website?
- How many pages an average visitor visit?
- How much time an average user spends on the website?
- From which platform the users visit the most?
- What countries do my website visitors belong to?
- Which websites direct traffic to my website?
- What sites the did users visit after visiting my website?
- What pages of the website are most popular?
- How much does a user scroll on my website?
- Which images are clicked the most on my website?
- What videos are watched the most on my website?
- Is my website mobile friendly?
- Which method suits my website the best?
- What is the number of successful conversions on the website?
- Is my website speed optimal?
- How to increase the website speed?
If you face similar questions, Google Analytics can help you to answer each questions with ease. Apart from these, there are several inside information about the website that you can get answers to using the help of Google Analytics.
Google Analytics is the most popular website analytics service provided by Google. It is used by millions of websites all over the world.
Here the information is provided in the form of charts, tables, graphs, and maps.
In spite of the numerous features that it provides a major portion of the web owners do not use these and lack from utilizing the full potential of their website.
It is quite simple and easy to set up Google Analytics on your website and get the information about your website.
But, in some of the cases, getting some detailed information about the performance may turn out to be a bit tricky.
This article intends to help you set up Google Analytics for your website and also get an idea on how to use some most commonly used important features which can be quite easily used by you.
To get some more detailed analysis, you need to dive deep into the Google Analytics and help you further make the most out of your website.
Prerequisites of Using Google Analytics
In order to use Google Analytics, it is necessary to have a Gmail account and a working website.
This account can be used to access several other services provided by Google like YouTube, AdSense, AdWords, Google Books, Google Scholar, Google Maps, etc. and various other such websites.
If you already own such a Gmail account, this can be used to access the Google Analytics. If you do not have a Gmail account it is advised to create one which is quite easy to do.
In a single Gmail Account, you can set up to 100 Google Analytics account.
Under 1 Google Analytics account, you can add up to 50 website properties and under each website property you can set up to 25 views.
How to Set up Google Analytics?
In order to setup Google Analytics account just go through these simple steps mentioned below:
- Visit the Google Analytics home page.
- Login to the website after entering your username and password.
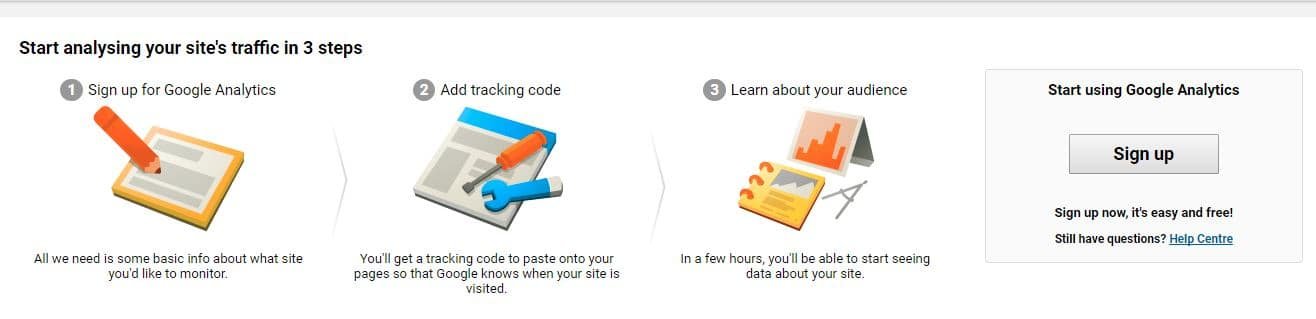
- If you are a new Google Analytics user, you need to start with 3 steps.
- In the first step, you need to sign up for using Google Analytics.

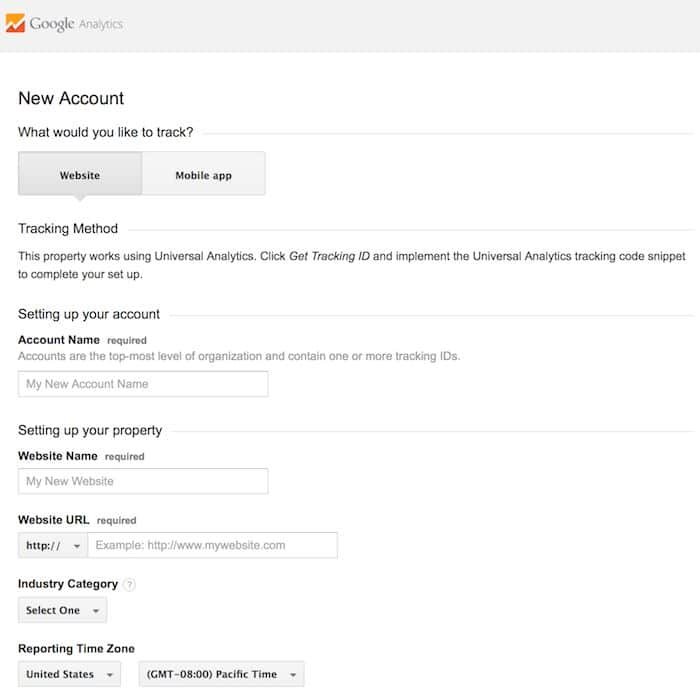
- Then you will be asked to fill out the information about your website. Here you need to fill out the Account Name, Website Name, Website URL, Industry Category, and Reporting Time Zone.
The name of the website and other properties can be updated at any point of time. Configure the data sharing settings for Google products and services, benchmarking, technical support, and account specialists.
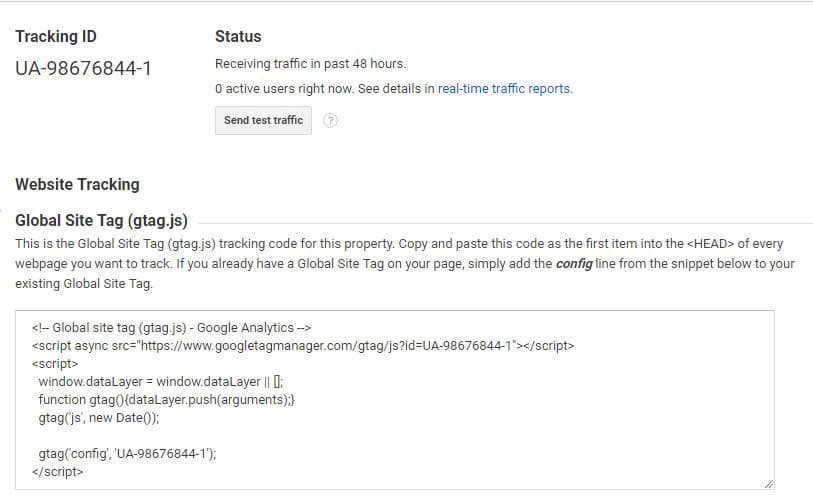
However, you can also choose the option to stop sharing the data by unchecking the appropriate checkbox. - Now click on the Get Tracking ID button after which you will be presented with a popup after agreeing to terms and conditions.
A tracking ID and tracking code are generated as well. Now, this tracking code needs to be entered in each and every web page to enable the tracking.
- In the first step, you need to sign up for using Google Analytics.

It is, however, necessary to make sure that you set up the Google Analytics in your personal account as the properties cannot be moved from one account to another.
If you are shifting from one account to another you will have to set up the properties again. Along with the same, any historical data associated with your website will be lost.
How to Enter the Tracking Code on Your Website?
After you have successfully got the code the next important task is to enter the code in different web pages. Depending on the web framework, you choose, you can choose the option to add it in various ways.
In case you are using an HTML and CSS design website, you need to paste the code in each of the individual pages before the </head> tag of your web page. Save it again and then you are good to go.
However, if you are making use of the Content Management System (CMS) like WordPress, Prestashop, Drupal, etc. each of these has their own individual methods of adding Google Analytics code. In this case, you need to enter the code in a single place and it is applied to each of the web pages.
There are several themes and plugins that make it quite easy to enter Google Analytics code. Search for such plugins or themes and follow the steps as mentioned in their documentation.
How to add additional account and properties to Google Analytics?
In some cases, you may find out that the existing account and properties are not sufficient. In such a case, you can choose the option to add additional accounts and properties.
In order to create an additional account, just head over to the Admin menu and click on the drop-down menu under the account column after which the link Create new account appears and enter the information requested.
In order to create a new property link head over to the Admin tab and click the drop-down under the property column. A Create new property tab appears where you need to enter the information requested.
How to set up Goals on your website?
Every website is developed with some end goal in mind.
These may belong to certain kinds like the sale of a product, newsletter subscription, video watched, payment made, contact form filled, visiting a certain page, etc. T
hese important events can also be tracked with the help of Google Analytics. Suppose you wish to track the successful orders placed or the number of newsletter subscriptions made.
But in order to do so, you have to set up goals. In order to measure this, you have to design a page that the user visits after the conversion. After having done so, follow the steps below:
- Click on the Goals tab and then click on the new goal option.
- Now you need to select a goal from the pre-selected templates of revenue, acquisition, inquiry or engagement. You can also choose the custom option as well.
- Set up the goal after which you can track if your goals are achieved.
Viewing Google Analytics data:
After setting up Google Analytics, the next big step is viewing the Google Analytics data. This helps you provide various information on the website.
Audience Overview:
If you have a single website, the Audience overview report of the website is displayed, if you have multiple websites, you can choose the website and view its audience overview.
It is quite an important data and can help you to get an idea of the visitors, visitor behavior, visitor’s device, and many more such information.
If properly understood, this may help you get an idea of the merits and demerits of your website. Along with the same, it can also help you to make appropriate changes to your website to make sure that you satisfy your visitors.
First of all, a graphical report with sessions is displayed.
This can be grouped hourly, daily, weekly, and monthly. You can also choose your own date range.
However, if required, you can choose the option to view the detailed description of the number of users, page views, page/session, session duration, bounce rate, and new sessions%.
This information may help you to get an idea of the performance of your website and how the users are interacting on your website.
In case you find out that there is a higher bounce rate and low session duration and page/session, in such a case, it becomes necessary that you lay focus on the ways to keep your visitors engaged and provide more and more relevant information.
The new session helps you to decide if the website is reaching to new people or not. However, it is also necessary to make sure that the visitors return to your website.
You can also compare your data to previous date ranges. This will help you to monitor your performance and to get an idea if your website has fared better or worse.
Some other information like demographics, browser information, language, operating system, service provider, service provider and screen resolution is also displayed.
You can click on these to get a detailed overview about each of these. Further clicking on these will provide you with a detailed information about your website performance.
There are different types of reports that you can view for your website. This can be done by clicking on the links on the left-hand side.
Various relevant information about the visitors can be gained under the tabs real-time, audience, acquisition, behavior, and conversions.
Here you can find information about active users, cohort analysis, demographics, interests, Geo, Behavior, Technology, Mobile, benchmarking, traffic, AdWords, SEO, Social, Campaigns, Site Content, Site Search, Site Speed, etc.
- Active users section displays you the information about the visitors.
- In the demographics section, you can view the information about the user age groups, and Gender.
- In the Geo section, you can get an idea of the language and location of the visitors.
- The behavior section displays information whether the users are new users or the returning visitors. It also tells you about the Frequency & Recency and engagement of the visitors.
- In the technology section, you can get information about the browser, operating system, screen resolution, screen colors, flash version and several related information.
- Site Search helps you to provide information about what keywords are searched on your website.
- Site Speed helps you get an idea of the load time and then can help you to decide what necessary changes need to be taken to enhance your site speed.
Apart from this several other information displayed on Google Analytics.
Based on these, you can select to take some important decisions.
Suppose you find out that a majority of your visitors fall in the age group of youngsters in the demographics section. Then you can plan to target audience based on the same age group and draft content regarding the same.
In the best performing pageviews, you find out that a number of users add the product to the cart but do not make the purchase. Then you can plan accordingly to make changes to the order placement page.
The performance of the traffic and AdSense helps you get an idea if your advertising campaign is performing properly or not.
How to track your website events in Google Analytics?
Apart from these tasks, you may sometimes also feel the need to track some events on your website.
You might feel the need to get an idea of how long the people watched a video on your website, how many times an external link has been clicked, how far a user scrolled on your website, how many times a file has been downloaded, how many times a post has been shared, and several more such events.
This will help you provide information on how the users are interacting with your website. E.g. Video tracking can be beneficial for the websites with video content while scroll tracking can help in the blogs.
These can be done with the help of certain events on your website like mouse events, keyboard events, frame event, form events, etc. with the help of their respective handlers.
Apart from these, you can also track some events like debugging events, scaling events, video tracking, scroll tracking, e-commerce tracking along with several others.
The Google Analytics events are made up of event category, event action, event label, and event value. You need to specify the eventCategory, eventAction, eventLabel, and eventValue in the same order.
Make sure that you use distinct event actions as it will lead to reporting only one unique event. Some page events can also be used with the help of event handlers which can help you to monitor mouse, keyboard, forms, and frames.
If you have an E-commerce company, the Google Analytics tool can help you to get an idea of your performance, your visitor turn on’s and turn-offs, and the performance of your promotional campaign.
This may help you monitor your progress and also make some changes that will help you perform better in future. After setting up the traditional e-commerce tracking, you will be shown with 5 reports, i.e.
- E-commerce overview
- Product performance
- Sales performance
- Transactions and
- Time to purchase.
Whereas if you install the enhanced e-commerce tracking on your website, you will be able to see 10 reports about the performance of your website. These consist of:
- E-commerce overview
- Shopping behavior analysis
- Checkout behavior analysis
- Product performance
- Sales performance
- Product list performance
- Internal promotion
- Order coupon
- Product coupon and
- Affiliate code
These help you to get an inside information about the performance of your website and will also help you to decide what changes you must implement into the website to get more and more customers and get better conversions.
How to create your own custom Google Analytics dashboard:
Google Analytics is quite a popular tool and offers a dashboard where you can view the performance of your website.
However, in some of the cases, some reports turn out to be more important. Hence, you can create your own custom dashboard and view the reports that suits you the best.
In order to do so, just follow the steps mentioned below:
- Click on the +New Dashboard option under the Dashboard menu.
- Choose from the option Blank Canvas or Starter Dashboard.
- Add the elements that you wish to view in your dashboard and arrange the same as per your convenience.
- You can also share your dashboard configuration. This, however, doesn’t display the Google Analytics account.
In case, you do not want to get into the hassles of creating your own dashboard, you can look for the custom dashboards and use it on your own.
How to set up Internal Site Search:
The Internal site search if implemented properly can turn out to be quite a useful tool.
Using this you can get an idea of what your visitors expect from you. Suppose, you are a video hosting company and you get searches for the funny videos which yields no results.
Then, you can take proper steps to provide the relevant content and increase the number of visitors.
In order to set up internal site search, here are the steps that need to be followed:
- Go to your Google Analytics and login to your account after entering your credentials.
- Click on the Admin button.
- Click on the Profile Settings button.
- Click the bottom Site Search Settings and then select the option Do Track site Search
Here you can also get some other information like sessions with search, total unique searches, results pageviews/search, %search exits, etc.
These reports are displayed under Behavior > Behavior Flow > Site Search > Usage. Here you can also click on different tabs and view different results based on usage, search terms, pages, and segment.
Using this information, you can get to know the searches the visitors are conducting on your website. In case the results related to the queries are not available, you can generate the relevant content based on the same.
This information helps you to get a basic idea of using the Google Analytics on a basic level and deduce some quite important information about the user’s behavior of your website, and your website performance.
This information will help you easily monitor your website performance and plan accordingly. Make sure to start using Google Analytics on your website and explore more of its important features to help your website grow by leaps and bounds.
Aviv Digital is one of the leading digital marketing training institutes in Cochin, Kerala.
We offer a wide variety of globally recognized certification programs that include SEO, SEM, SMM, Email Marketing and Inbound Marketing courses. For more details, Contact us at +91 9995119846